-
SOLUTIONS
MANUFACTURER
NETWORKPERFORMANCEProactive network management to connect today’s consumers with automotive more efficiently.
SALESPERFORMANCEUncover what really impacts daily performance to grow market share.
AFTERSALESPERFORMANCEBring customers back to increase service retention and build long-term loyalty.
MARKETINGPERFORMANCEScientific precision to make every marketing dollar work harder.
- INSIGHT LAB
FEATURED
April 29th, 2024Shades of Change: How Color Preferences could influence EV adoption.April 1st, 2024Charging ahead: navigating the dynamic evolution of the UK’s electric vehicle market in 2024March 11th, 2024Tech Century: From Dots on a Map… to Guiding Short- and Long-Term EV Success - NEWSROOM
- ABOUT US
- CAREERS
- EVENTS


Urban Science Annual Index:
evolving the auto retail network to take advantage of the EV opportunity
By 2024, U.S. auto buyers will have more than 130 electric vehicle (EV) models to choose from. Who and where people will buy from, however, will be dependent on a number of factors, including whether the automotive retail network in the U.S. – and the brands that comprise it – is prepared to serve them. How franchise dealerships factor into this equation is one of the key topics in the 2023 Urban Science Dealership Transformation Index™ (DTI)1. In its second year, the DTI once again explored auto-buyer perceptions regarding the impact of EVs on the marketplace, the role of dealerships in the EV buying process and the barriers – real and perceived – to making the leap to EVs.
June 19th, 2023
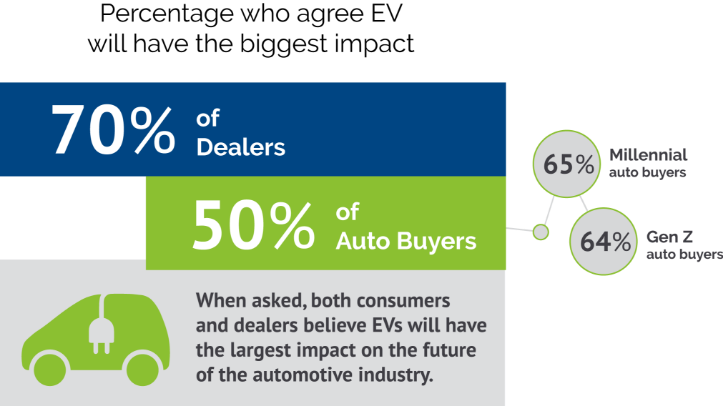
Dealers and auto buyers agree:
EVs have greatest potential to change the industry
When we asked auto buyers and dealers to rank a series of innovations and technologies regarding their potential to change the future of the automotive industry, 70% of dealers and 50% of auto buyers ranked EVs #1. Note: the auto-buyer percentage is a composite, with the heaviest representation from Gen Z buyers (64%) and millennials (65%). The gap between dealers and the two largest auto-buyer demographic constituencies, Gen Z and millennials, is a critical one to watch since these generations are expected to drive the bulk of future EV sales.
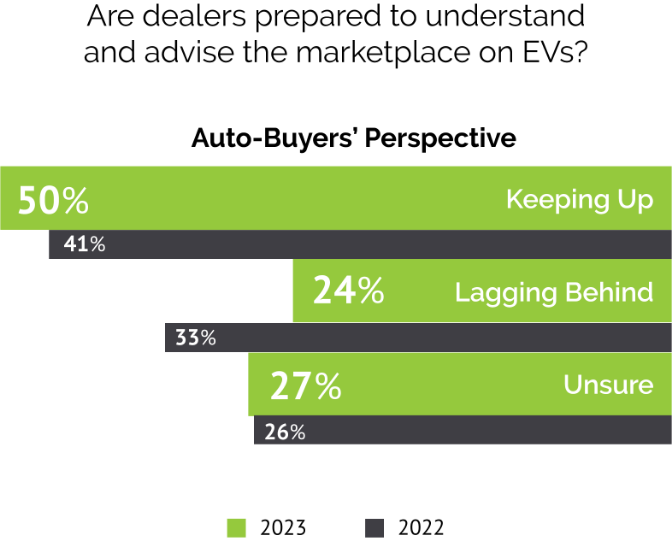
Shopping for EVs: what auto buyers believe about dealer readiness and what they want from dealers
This year’s DTI research showed an improvement in how auto buyers believe dealers are keeping up on understanding and advising the marketplace on EVs. In fact, the only demographic that declined in this regard was Gen Z, with a statistically insignificant movement from 41% to 40% year over year (YoY). Millennials and Gen X auto buyers had the largest YoY changes (at nine-percentage-point and 12-percentage-point increases, respectively), while overall the auto-buyer category jumped from 41% to 50%.
While 33% of auto buyers in 2022 said dealers were lagging behind, only 24% expressed that view this year. It’s important to remember, however, that even with improvement in these areas, half of auto buyers still believe dealers are lagging behind, or unsure, making it critical for dealers to continue EV education and investment.
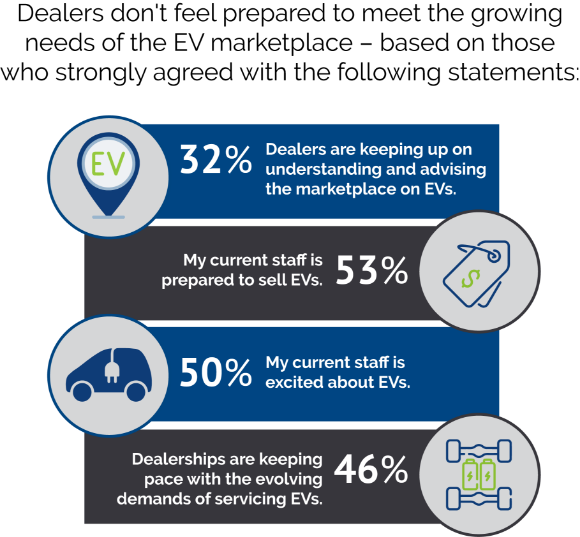
On the other side of the equation, 32% of dealers believe they’re keeping up regarding understanding and advising the marketplace on EVs — significantly lower than the perceptions of auto buyers this year. Yet dealers view other EV-related perspectives in a different light: 53% of dealers strongly agree “my current staff is prepared to sell EVs,” with 50% of dealers strongly agreeing their current staff is excited about EVs and 46% saying their dealerships are “keeping pace with the evolving demands of servicing EVs.”
How is it that only 32% of dealers believe they’re keeping up while at the same time 53% believe they’re prepared to sell EVs? “Keeping up on understanding and advising” is a challenge given the uncertainties of factors such as range, price and the overall infrastructure needed to support EVs, while “my current staff is prepared to sell EVs” reflects a known quantity (their staff) and the belief they’re up to the task. Dealers are also aware there’s often a chasm between “understanding” and “advising,” which may better explain the difference between the two sentiments.
Barriers to EV Adoption
Things dealers and auto buyers can (mostly) agree on
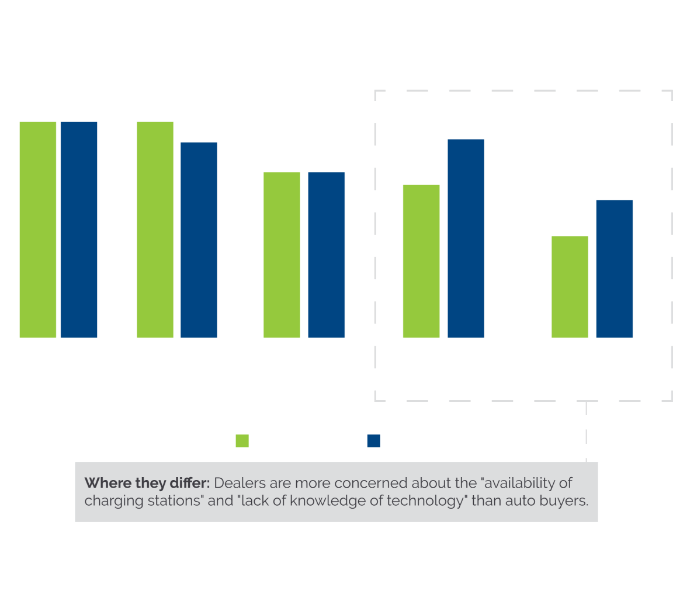
Battery range and cost are tied for auto buyers’ top barrier to buying an EV – and that’s nearly identical to dealers’ perceptions. There’s also concern among both auto buyers and dealers regarding the need to install a charging station at home. This is especially important when the definition of “home” is expanded to rental units, where auto buyers may not have a say in whether the rental complex will allow (or can be equipped) for “home” charging.
Where auto buyers and dealers begin to diverge can most readily be seen in two categories. In “low availability of charging stations,” dealers express higher concern. The same is true with “lack of knowledge of tech,” which goes back to dealers perhaps not being as confident regarding “advising” auto buyers.
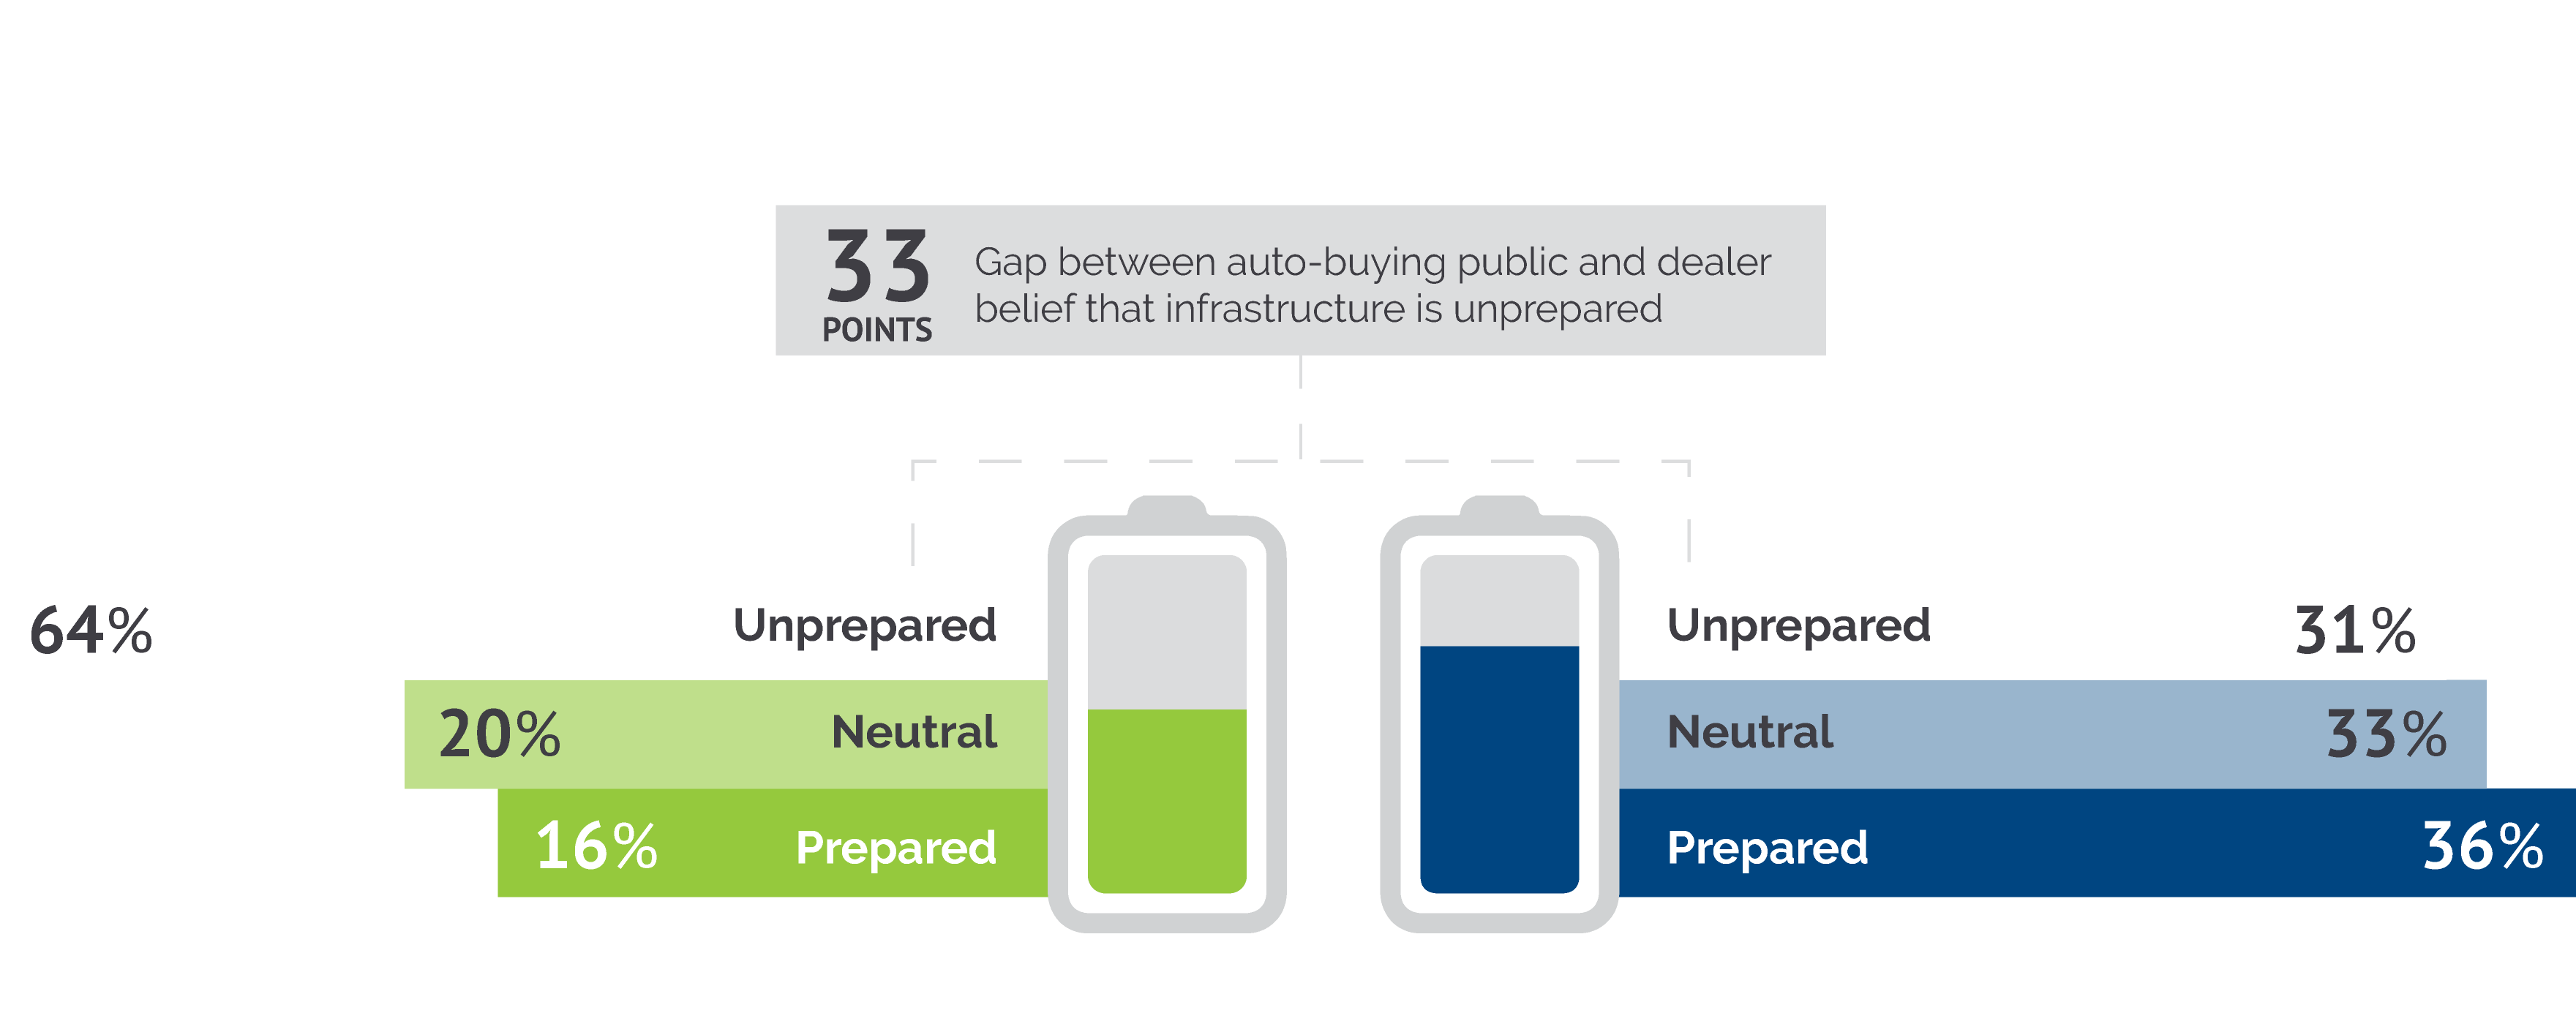
When asked about what they think will occur over the next three years, dealers are much more confident the charging infrastructure will be prepared for increasing EV adoption. Still, that represents a 33-percentage-point gap between beliefs of the auto-buying public versus those of dealers.
Looking down the road to electrification through the lens of Urban Science’s near-real-time industry sales data
At Urban Science, our unrivaled near-real-time industry sales data allows us to forecast for EV sales and charging demand, so we can more accurately identify locations where EV demand is likely to grow. As a result, OEMs can better optimize their networks for EV sales and charging needs to enhance customer convenience.
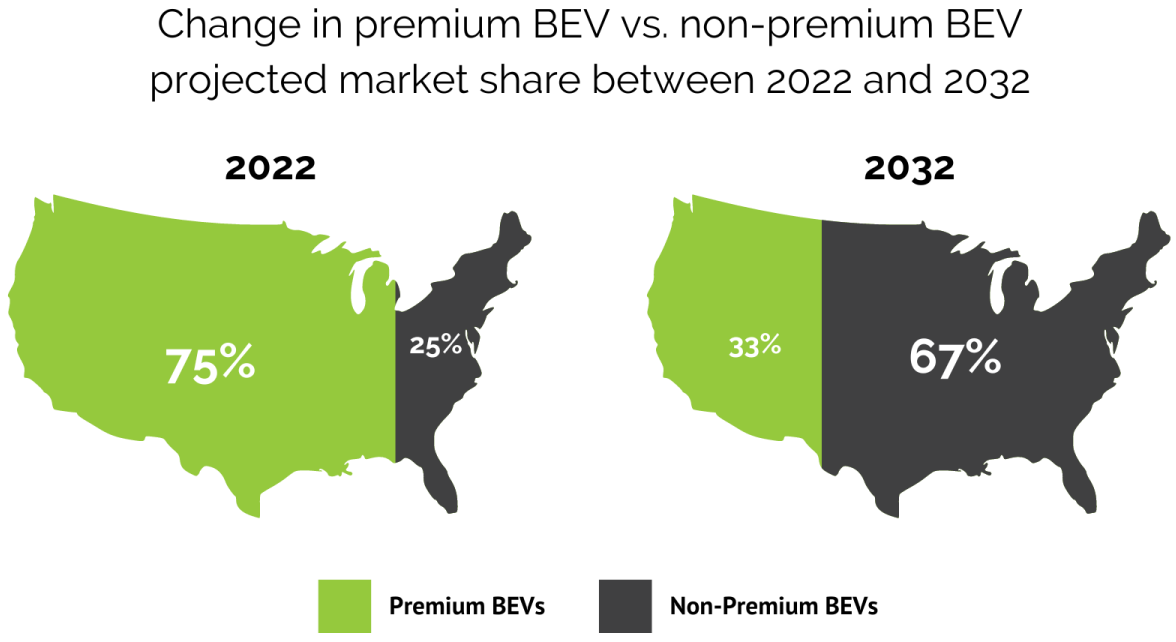
While BEVs are currently 16% of total retail automotive sales, they’re expected to represent more than half (55%) in just 10 years. At the same time, auto manufacturers will generally transition from premium EVs toward non-premium models to drive broader adoption. Most BEV sales today are in the premium segments, but that will change over time as more EV options become available across all segments and EVs become more affordable. By inference, reaching more to the masses will necessitate lower price points and require more public charging support.
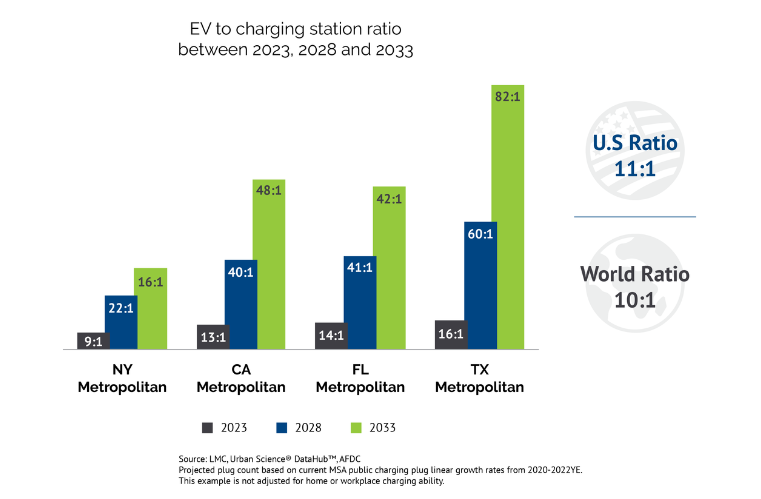
To better understand the challenge, it’s helpful to look at “EV-to-plug” ratios, or the number of EVs compared to the number of available plug-in receptacles in a market (note: a charging station may have multiple plug-in receptacles). Through this lens, South Korea (at 3:1) and China (at 7:1) are the undisputed leaders, with the U.S. coming in at 11:1. Fast forward to 2028, and — although plugs increase from 156,000 to an estimated 403,000 — the ratio soars to 32:1 in the U.S. By 2033, with a projected 1.236 million plugs, we expect that ratio to see only marginal relief, at 29:1 in the U.S. (EV:plug).
Compounding this issue (and the overall barrier to mass adoption and convenience), EV growth — especially with its dependence on an EV infrastructure able to sustain mass adoption — is not consistent nationwide. Understandably, top growth markets will be concentrated in metropolitan areas, where there are more people and consequently, more vehicles. But all metro areas are not equal.
In all New York metropolitan areas, for example, the EV-to-charging-station ratio goes from 9:1 today, to 22:1 in 2028, before settling at 16:1 in 2033. In all Texas metropolitan areas, by way of comparison, the ratio goes from 16:1 today, to 60:1 in 2028, and then skyrockets to 82:1 by 2033. Those numbers reflect Texas’ relative lag in adding charging stations when the state’s EV growth rate was low (2020-2022).
Although projections, these numbers — driven by Urban Science’s near-real-time industry sales data and proven scientific processes and methodologies — highlight the challenges going forward as multiple stakeholders aim to create an infrastructure that can meet the needs of a burgeoning EV marketplace.
Actions the automotive industry can take right now
- Tap the power of near-real-time industry sales data — and science — to know where and when EV demand is likely to rise geographically and how that affects your specific market so that you can be better equipped to evolve your network to capture the opportunity. That includes preparing you for the required charging infrastructure at dealerships and reviewing EV sales and aftersales coverage.
- Monitor evolving local EV segment preferences to better anticipate customer needs.
- Invest in education for both dealership sales teams and consumers. Education is a key factor in a consumer’s willingness to purchase an EV, and a dealer’s ability to effectively sell an EV.
- Adapt dealership facilities to ensure a flawless hands-on experience, from having a fleet of EVs charged for test drives to ensuring fast DC charging is available for aftersales customers.
- Evolve the traditional sales value proposition for EVs to go beyond traditional finance and insurance (F&I) consideration by doing things like bundling EVs with home charging installation to remove any potential barriers to purchase.
- Empower your customers with knowledge; ensure you’re aware of all local incentives and become an expert on the location, capacity and (charging) speed of all public charging stations.
Science as a solution
Since our founding over four decades ago, our unrivaled near-real-time industry sales data, and consulting and technology offerings have driven innovation, efficiency and profitability into every corner of the automotive industry. That continues today as we move into the EV future. Our capabilities and industry expertise help OEMs, dealers and the advertising technology firms that support them, to stay ahead of EV trends and achieve sustainable, optimized networks around the growing demand in the segment.
Looking ahead, we’ll report on a multitude of areas of opportunity related to our DTI research, revealing additional auto-buyer and dealer insights that can guide OEMs and dealers to science-driven strategies that will improve performance. Look for our insights regarding omnichannel retailing, new retail formats, dealership service, consumer purchase behaviors and dealership performance measurement soon.
In the meantime, if you’d like to talk to someone at Urban Science about how we can maximize your network for EV sustainability – or if you have any questions about the information included in this article – please contact us now.
Read next article
1. This survey was conducted online by The Harris Poll on behalf of Urban Science among 3,022 US adults aged 18+ who currently own or lease or plan to purchase or lease a new or used vehicle in the next 12 months (referred to in this report as “auto-buyers” or “auto-buying public”), and 250 U.S. OEM automotive dealers, whose titles were Sales Manager, General Manager, or Principal/VP/Owner.
The auto-buying public survey was conducted from January 26 to February 15, 2023. Data are weighted where necessary by age by gender, race/ethnicity, region, education, marital status, household size, household income, and propensity to be online to bring them in line with their actual proportions in the population. The dealer survey was conducted January 26 to February 17, 2023. Results were not weighted and are only representative of those who completed the survey.
Respondents for this survey were selected from among those who have agreed to participate in our surveys. The sampling precision of Harris online polls is measured by using a Bayesian credible interval. For this study, the sample data is accurate to within +2.6 percentage points for auto-buyers and +6.2 percentage points for dealers using a 95% confidence level. This credible interval will be wider among subsets of the surveyed population of interest.
All sample surveys and polls, whether or not they use probability sampling, are subject to other multiple sources of error which are most often not possible to quantify or estimate, including, but not limited to coverage error, error associated with nonresponse, error associated with question wording and response options, and post-survey weighting and adjustments
