
Every lost sale at a car dealership leaves behind valuable clues. When buyers leave for another dealership before a dealer contacts them or walk away after a follow-up, they leave behind valuable insights regarding their reasons for leaving. Even worse, most times these insights lurk beneath surface-level CRM data and one-off defections (lost sales) become patterns that cause deeper loyalty and profitability challenges.
What went wrong? Where did the breakdown in the sales funnel occur? The answers to those questions are crucial to decreasing defections and improving conversions in today’s competitive market. With customer loyalty growing increasingly fragile, understanding the “why” behind defections in near real time – and adapting quickly and efficiently – is key to sustainable growth.
The truth is, even the strongest sales teams lose valuable opportunities throughout the sales process. Our ongoing research and analysis, including insights from the 2025 Urban Science Harris Poll Study, show hidden leaks often follow predictable and correctable patterns if dealers are able to identify them quickly. By understanding where and why customers disengage on a daily basis, dealers can take targeted action to strengthen customer loyalty, close more leads and optimize every stage of the sales funnel. This includes the experience before the customer even steps foot in the door.
The Follow-Up Gap
One of the most common causes of lost sales is inefficient follow-up. Many dealerships focus precious time and resources on customers who are ready to buy immediately, yet most buyers now take longer to reach a decision. With affordability concerns influencing sales timelines, the average purchase journey often spans several weeks or months.
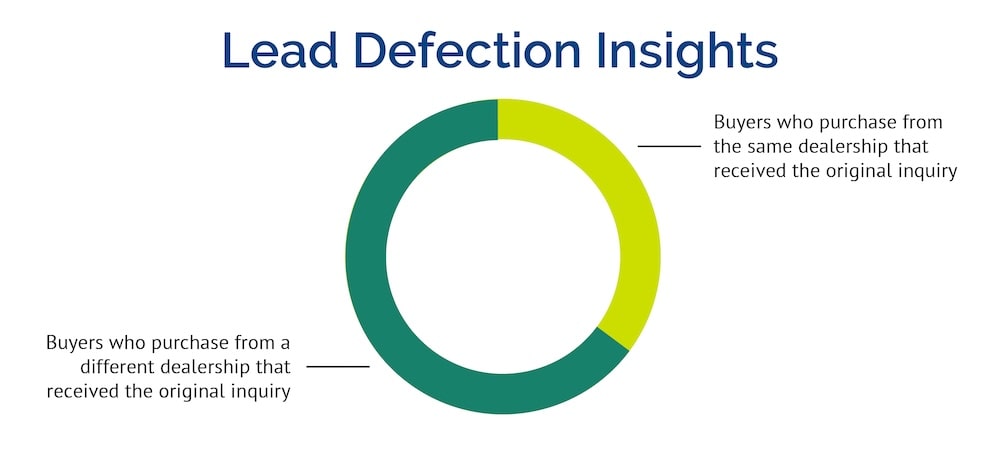
Defection analytics reveal only about one in three leads purchase from the same dealership that received the original inquiry. The remaining two-thirds are purchasing elsewhere.
This gap in follow up is rarely due to poor-quality leads. It usually results from follow-up that ends too soon. Dealers who align their engagement strategies with accurate buying cycles – informed by daily industry sales data – can improve conversion rates. Tracking days-to-sale data helps internal teams identify when communication slows and when to reengage. A longer, more consistent outreach process ensures buyers remain connected through every stage of their journey.
Not All Leads Are Treated Equally
Treating every lead the same often causes unnecessary defections. Segmenting leads by source and stage in the sales funnel allows dealerships to match outreach to each customer’s needs.
Early stage shoppers typically require unique outreach and a longer, more consistent cadence of communication that covers critical information and builds transparency and buyer confidence. Customers further along in the process often look for quick answers, pricing clarity and confidence that inventory is available so they can transact right away.
When dealers understand these differences, they can tailor customer engagement to match. Marketing budgets can also be refined to prioritize lead sources that deliver the highest-quality opportunities. These small adjustments strengthen performance and create more consistent results across the sales team.
Using Defection Data to Support Training
Daily defection data can also guide how dealerships train their sales teams. By viewing defections on a seller-by-seller basis, managers can identify which lead sources and types of traffic each team member handles well and where they might need additional support. One salesperson might perform well in the showroom but lose online leads after the first contact. Another might be strong in digital communication but weaker in closing deals over the phone. These daily insights make training more precise. Managers can deliver timely, focused coaching that bridges specific skill gaps rather than broad, generalized sessions.
Training is also where the lead audit process becomes valuable. During one-on-one sessions, managers can review defections directly in their CRM to assess whether the sales process was followed, where personalization could have been added or if key follow-ups were missed.
Over time, this data-driven approach leads to better consistency, higher performance and more informed sales strategies across the organization.
The Online Experience Disconnect
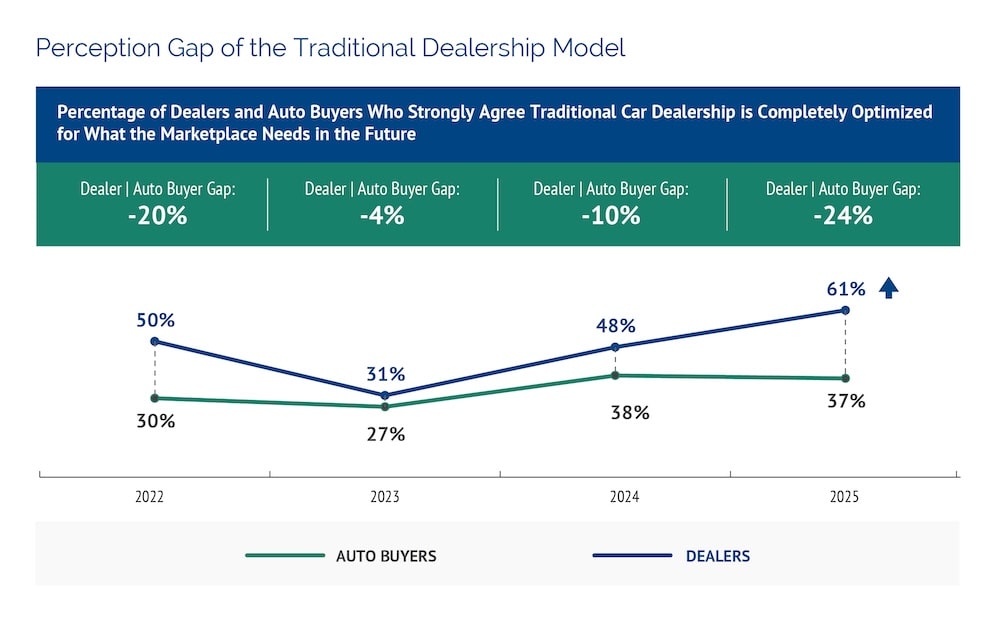
Urban Science’s 2025 Harris Poll Study found a 24-point gap between dealers and auto buyers regarding how optimized the traditional dealership model is for the future. Most dealers currently believe their operations are evolving effectively, but many buyers haven’t experienced positive change, especially online.
Since most shoppers start their car-buying journey digitally, a poor or inconsistent online experience can result in early defection, sometimes before a lead is even captured. Analyzing daily defection data helps dealership leaders pinpoint where and when the disconnect in buying experience happens.
Once dealers identify their hidden leaks in their sales processes, they can better understand – and create – the online experience expected by today’s auto buyers. From there, teams can leverage transparent pricing, responsive communication tools and timely follow-ups, all of which influence whether a shopper stays engaged or clicks away.
Stacking up Against the Competition
Defection patterns vary across brands, markets and even individual dealerships. Urban Science benchmarking data – based on national, brand, regional and primary market area (PMA) performance – helps dealers understand how they’re performing relative to their peers.
These benchmarks provide critical context. A dealer might appear to be underperforming at first glance, but if their brand or region is also struggling, it may point to broader market challenges. On the other hand, if a dealer is underperforming while their brand and region are doing well, it’s a strong signal that internal processes – like lead handling or follow-up – may be the root cause.
By comparing their defection rates against relevant benchmarks, dealers can separate external market pressures from internal performance gaps and take more targeted action to improve outcomes.
Misdiagnosing the Problem
When sales soften, the immediate reaction is often to buy more leads. Without insight into why current leads are not converting, marketers and sellers will rarely see their investment improve outcomes.
Defection data distinguishes between marketing challenges and sales execution gaps. If a large portion of lost leads later buy elsewhere, the issue is not marketing reach, but process performance. Dealers that use defection insights can focus their efforts on areas that directly affect results, such as improving lead handling and adjusting follow-up protocols.
Conversely, defection patterns can also reveal potential marketing issues. For example, lead sources with low close rates and low defection rates, leads converting in ZIP codes far outside a dealer’s PMA or an unbalanced lead mix may point to targeting inefficiencies or misaligned media strategies.
No dealership is immune to lead defection and sellers shouldn’t aim to eliminate it entirely or prevent every loss as doing so is impossible. By analyzing hidden leaks in sales effectiveness and marketing performance, leading dealers allocate resources more effectively and make decisions based on evidence rather than assumptions.
Interested in learning how to transform your sales strategy?
Check out Urban Science’s Defection Data Playbook, which provides dealers with actionable ways to harness daily defection data powered by Urban Science. Download our Defection Data Playbook to learn how to define defection (what it means and why it’s costing you sales), spot leads who already bought elsewhere, understand why leads defect, discover how to fix it and much more.
*This survey was conducted online by The Harris Poll on behalf of Urban Science among 3,026 US adults aged 18+ who currently own or lease or plan to purchase or lease a new or used vehicle in the next 12 months (referred to in this report as “auto-buyers” or “auto-buying public”) and 254 U.S. OEM automotive dealers, whose titles were Sales Manager, General Manager or Principal/VP/Owner.
The auto-buying public surveys were conducted from January 10 to February 4, 2025. Data are weighted where necessary by demographics to bring them in line with their actual proportions in the population. The dealer survey was conducted January 9 to January 30, 2025. Data were weighted as needed based on the average of current and previous waves for gender, car types sold, job title and urbanicity.
The sampling precision of Harris online polls is measured by using a Bayesian credible interval. For this study, the sample data is accurate to within ±2.2 percentage points for U.S. auto-buyers and ±7.1 for U.S. OEM automotive dealers using a 95% confidence level.
