
Dealers have good reason to feel optimistic about the state of the automotive industry heading into the end of 2025. As of October 31, year-to-date retail industry sales volume was up 3 percent, lead volume was up 8.1 percent and lead sales were up 10.1 percent over the same time period in 2024. Yet, behind those gains lies a growing challenge. The number of leads that defected (purchased from a competing dealership) also rose 6 percent over the same period.
While most dealers closely track their close rate (the percentage of leads that convert to sales), fewer consider how it correlates with their defection rate (the percentage of leads that buy elsewhere). As competition for customers intensifies, it’s becoming increasingly important for dealers to understand the relationship between both metrics. The process of analyzing how close and defection rates interact starts with examining what the sales data reveals about lead behavior on a daily basis.
Reading the Signals Behind Sales and Defection Data
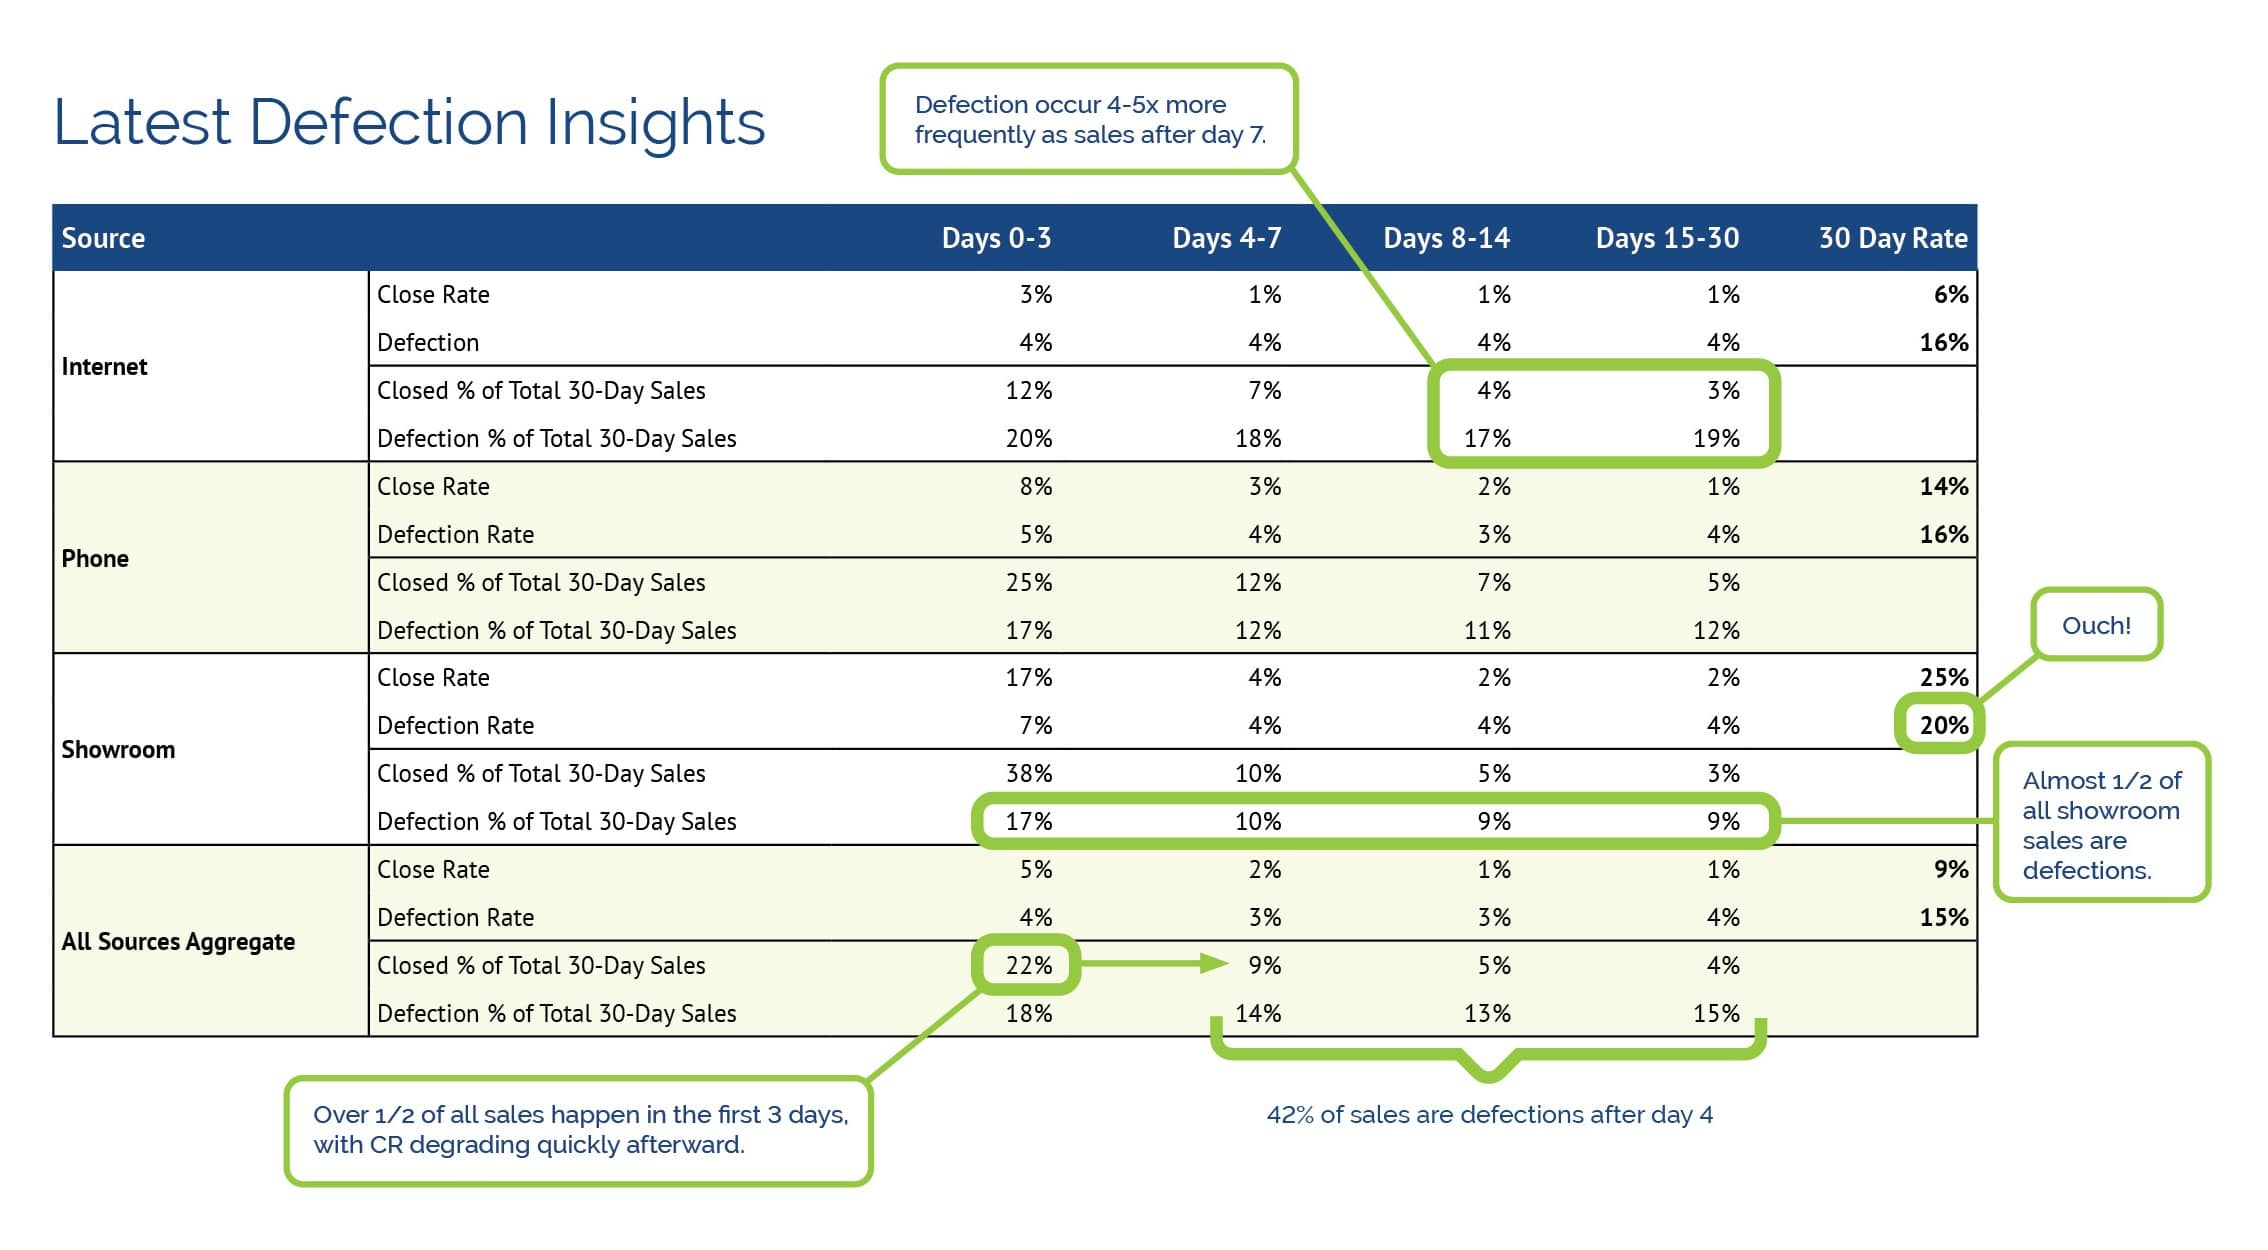
Comparing close and defection rates across lead sources reveals how buyer intent and engagement differ by channels. Urban Science’s analysis found internet leads (those originating from an online source) have an average 30-day close rate of 6 percent and defect at a rate of 16 percent. On the other hand, phone leads are closer to a 1:1 ratio of defections to sales, with a 14 percent close rate and 16 percent defection rate over the initial 30-day period. Unsurprisingly, showroom leads have the highest close rate at 25 percent over 30 days. However, showroom leads also have the highest 30-day defection rate at 20 percent.
May, June, July 2025 new leads and sales data
When viewed in isolation, close rates can create a false sense of security. A dealer might see their team is closing showroom leads at a 25 percent rate and assume the sales process is fully optimized. Once dealers compare their close rate to their defection rate, the complete picture of buyer behavior comes into focus — revealing just how much opportunity is left on the table.
By evaluating close and defection rates regularly, dealers can pinpoint where their process or messaging falls short. Are follow-up processes ending too soon? Are leads being matched to the right salespeople based on their strengths? Recognizing those patterns helps dealers see whether performance gaps stem from external conditions (such as rising customer expectations for faster, more personalized communication) or internal process issues, a critical distinction for improving results. Once dealers are empowered to identify patterns in their sales and defection data each day, they can better understand why buyers are defecting in the first place.
Why Auto Buyers Defect
The average dealership defection rate reached 20 percent in 2025 and continues to rise as economic conditions, buyer behaviors and dealer processes and tools evolve. Vehicle affordability is weighing heavily on consumers as inflation, tariff uncertainty and the expiration of federal tax credits for electric vehicles (EVs) all add new financial pressure. At the same time, rival dealerships are becoming more aggressive within local markets, targeting in-market shoppers and seeking to steal share in competitors’ primary market areas (PMAs). Dealers now face a challenging dynamic: higher lead volume but a growing share of lost opportunities.
A widening disconnect between dealers and consumers is adding to the complexity of monitoring and managing defection. Data from the 2025 Urban Science Harris Poll Study* revealed an approximately 20-point gap between what auto buyers and dealers perceive to be the biggest barriers to purchasing or leasing a vehicle. Almost two-thirds (64 percent) of auto buyers cited affordability as their top concern, followed by insurance costs (52 percent) and the cost to service vehicles (47 percent). But when dealers were asked to identify auto buyers’ top concerns, just 40 percent cited vehicle affordability, 37 percent said the cost of vehicle insurance and 28 percent said service costs.
Rising affordability concerns are changing how shoppers engage with dealers. As budgets tighten, many shoppers are submitting more leads to compare pricing and explore financing options, leading buyers to quickly rule out dealers who fail to respond promptly, thoroughly or with genuine courtesy. If a salesperson’s initial engagement falls short, shoppers are more likely to defect to another dealership: one where their concerns are acknowledged and addressed. By tracking defections daily, dealers can zero in on what stage in the sales funnel these breakdowns occur and use that knowledge to improve sales performance and retention.
Acting on Defection Insights
Defections are a normal part of doing business, but by using daily defection data to gain visibility into lost sales, dealers can gain a major competitive advantage. Research shows 74 percent of dealers are not fully satisfied with their ability to know if a lead has defected. This lack of visibility costs time and money as sales teams continue to follow up with shoppers who have already purchased elsewhere, wasting effort that could be directed toward leads who are still in market.
アーバンサイエンスの SalesAlert™ solution delivers daily insight into individual lead-level customer defections driven by the company’s unrivaled industry sales data. Dealers enrolled with SalesAlert are notified when a lead purchases a new or certified pre-owned (CPO) vehicle from another same- or competitive-brand dealership, allowing sales teams to focus on the opportunities still in play. Defection data also helps dealers identify where sales processes need refinement and where teams may benefit from additional coaching. In many cases, this means getting back to executing the basics brilliantly: tracking every lead, revising follow-up processes and ensuring every interaction adds value for the buyer. In addition, dealers can use defection data to tap into opportunities to re-engage lost leads through service, rebuilding loyalty and creating a bridge to future sales.
A SalesAlert Lift Study conducted by Urban Science found dealerships using daily defection data achieved measurable improvements in performance. Of the 260+ dealerships analyzed, those demonstrating high engagement with the SalesAlert platform (dealers averaging more than 13 logins per month) achieved a 6.5 percent average lift in sales performance and gained approximately 25 incremental sales over six months.
Getting the Complete Picture of Dealership Performance
When dealers rely solely on their close rate to evaluate success, they risk overestimating results and overlooking deeper performance gaps. Sales teams gain a more complete understanding of their performance when they assess both their close rate and defection rate.
As Urban Science’s data shows, dealers who learn from lost leads outperform their peers. Dealers gain a clearer path to sustained growth when they use defection data as a catalyst for progress. With both metrics in focus, dealers can fine-tune their processes, strengthen their customer engagement strategies and capture more future sales opportunities.
