The path to greater profit is more clear than ever. With this advanced system to monitor and improve sales performance, you can pinpoint sales opportunities to maximize return on investment. Every dealership that uses it has a chance to uncover an average of 300 units of incremental sales.
View the videoGain an unprecedented view of customer activity — who they are, how they shop and what they are buying in your territory.
Track and benchmark against the competition to see who is selling what in your territory. And how to strategize against competitive dealerships.
The most accurate and timely sales reports by model (weekly and monthly).
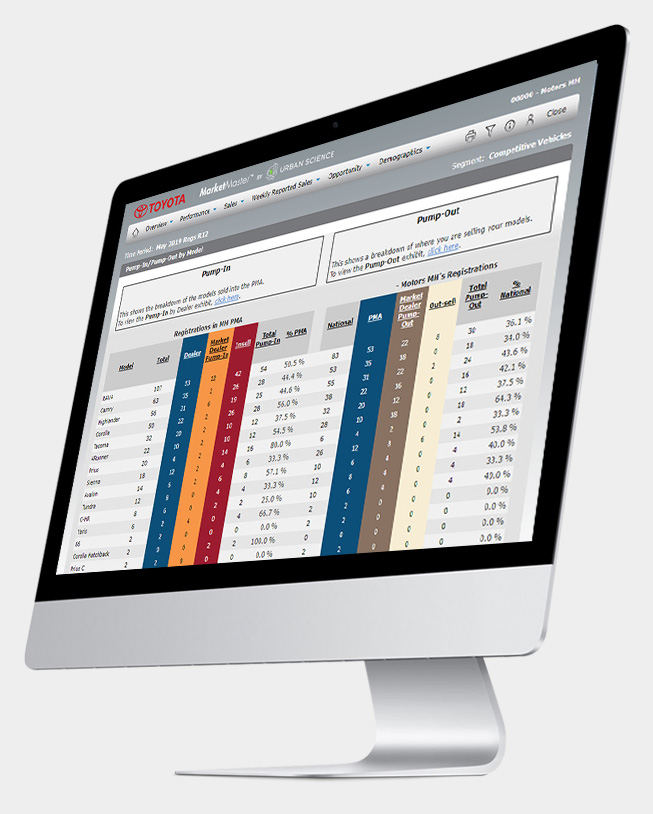
The Pump-In/Pump-Out exhibit shows the breakdown of which dealers sold into your Primary Market Area by model and what you sold outside of your Primary Market Area by model.
Gain an unprecedented view of customer activity — who they are, how they shop and what they are buying in your territory.
Track and benchmark against the competition to see who is selling what in your territory. And how to strategize against competitive dealerships.
The most accurate and timely sales reports by model (weekly and monthly).
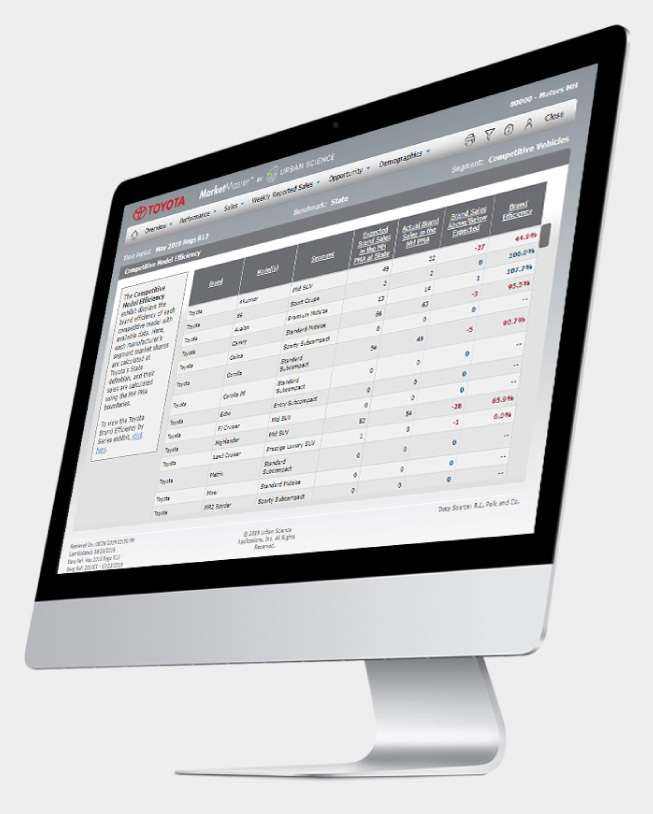
The Competitive Model Performance exhibit displays the brand efficiency of each competitive model to understand the customer purchase preference in the Primary Market Area.
Gain an unprecedented view of customer activity — who they are, how they shop and what they are buying in your territory.
Track and benchmark against the competition to see who is selling what in your territory. And how to strategize against competitive dealerships.
The most accurate and timely sales reports by model (weekly and monthly).
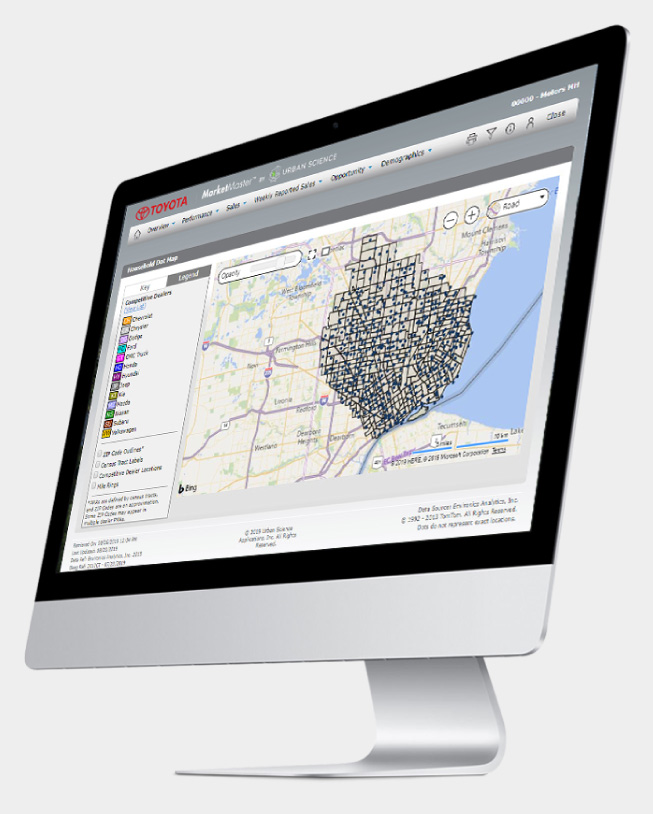
The Market Demographic Maps and Reports show the current and projected population trends in the Primary Market Area.
Gain an unprecedented view of customer activity — who they are, how they shop and what they are buying in your territory.
Track and benchmark against the competition to see who is selling what in your territory. And how to strategize against competitive dealerships.
The most accurate and timely sales reports by model (weekly and monthly).
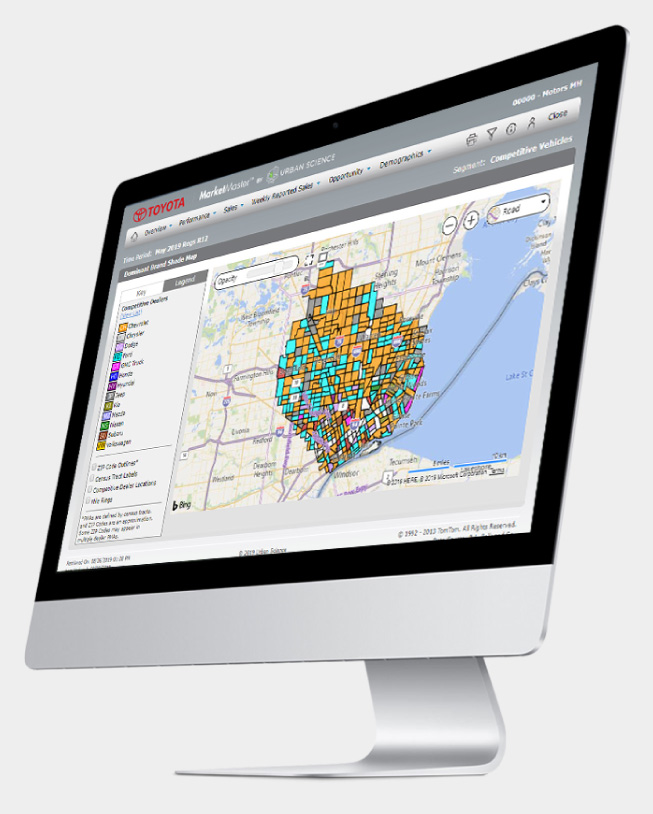
Quickly visualize the most popular brands in each Census Tract, or your brand's market share, with the color coded Shade Maps.
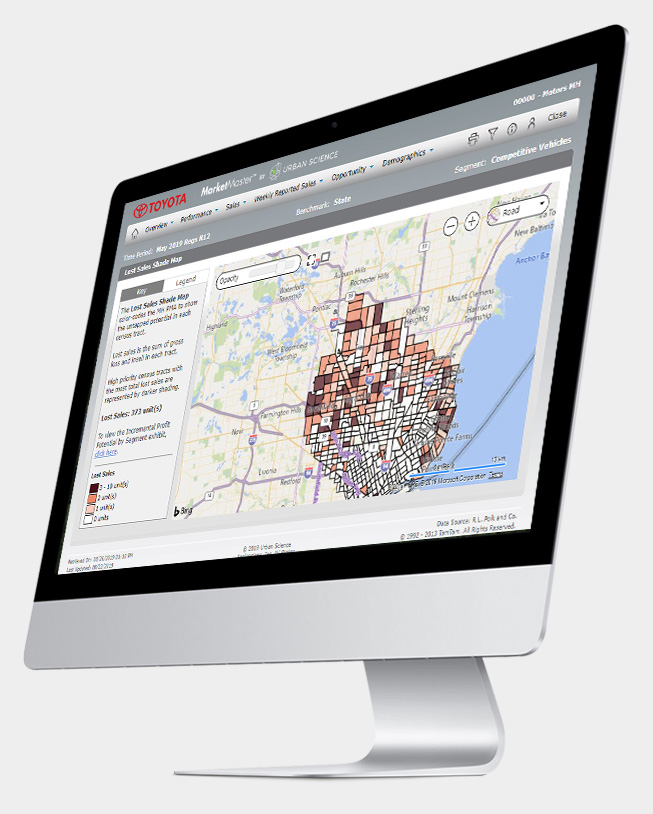
Uncover your missed new vehicle sales opportunities.
You'll have the ability to quantify lost profit dollars and seize actual opportunities by building quick-response action plans to target actual customers.
The Lost Sales Shade Map color codes the Primary Market Area to show untapped potential.
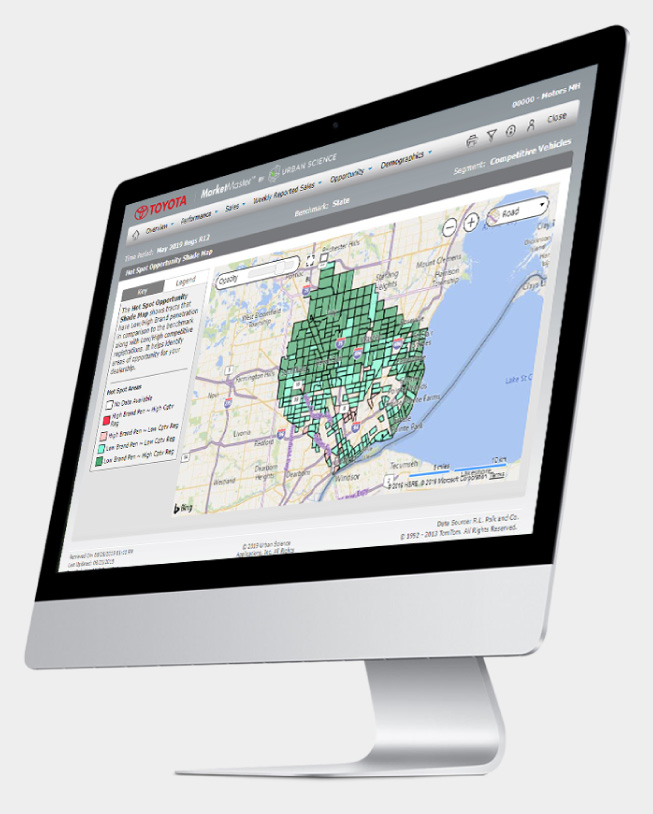
Uncover your missed new vehicle sales opportunities.
You'll have the ability to quantify lost profit dollars and seize actual opportunities by building quick-response action plans to target actual customers.
Discover areas of opportunity down to each Census Tract with the Hot Spot Opportunity Shade Map.
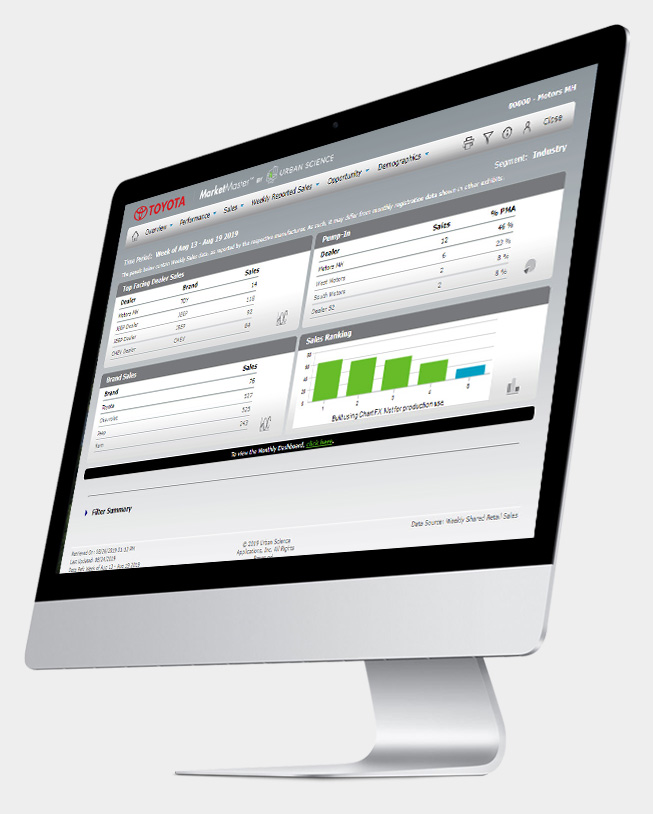
Stay ahead of the constantly evolving market. Track sales* vs. your competitors every week, so you can make faster decisions.
※売上は車両販売台数を指し、車両価格や収益を示すものではありません。
The Weekly Sales Summary provides quick feedback to the dealer on sales activities in the Primary Market Area by your brand and competitors.
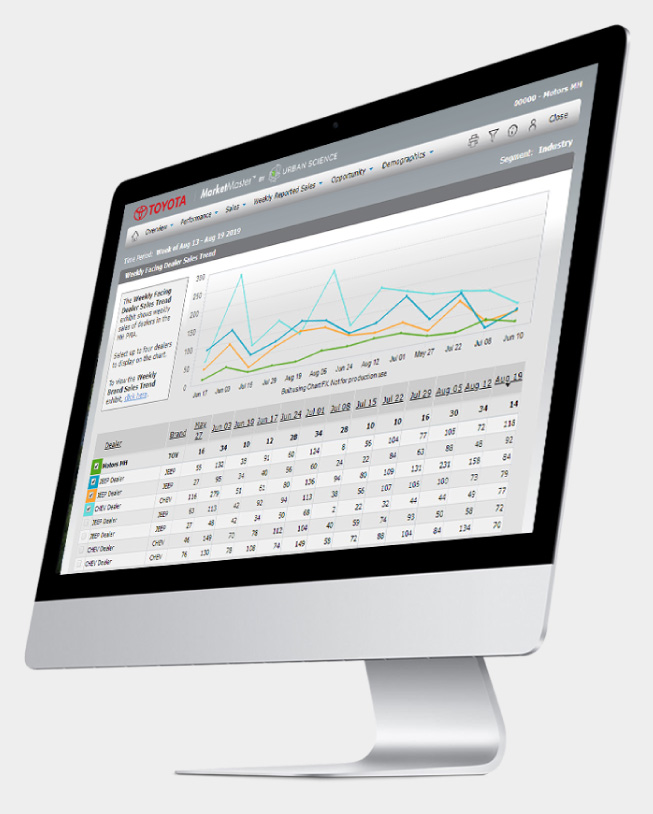
Stay ahead of the constantly evolving market. Track sales* vs. your competitors every week, so you can make faster decisions.
※売上は車両販売台数を指し、車両価格や収益を示すものではありません。
The Weekly Facing Dealer Sales Trend exhibits show weekly sales of dealers in the Primary Market Area to understand what neighboring competitive dealers are selling each week.
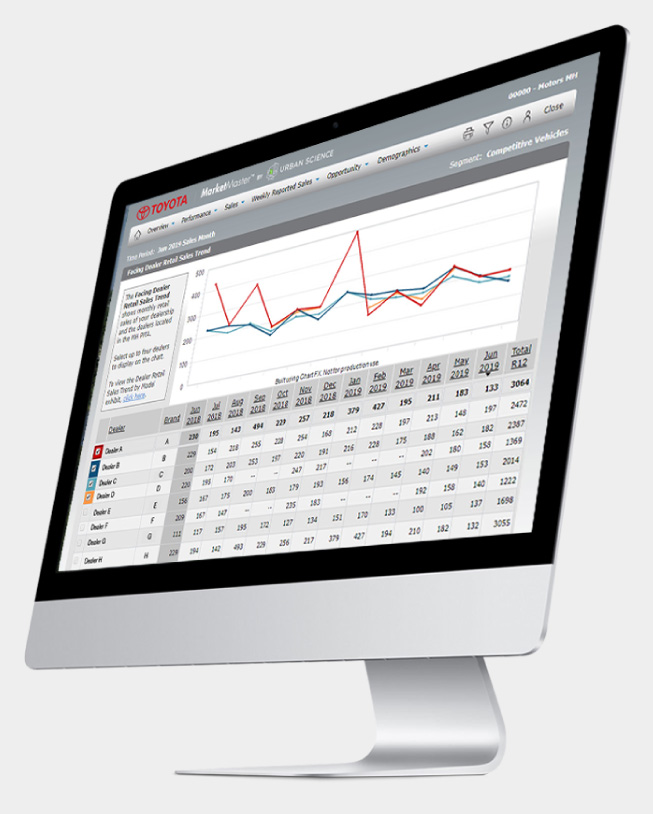
Stay ahead of the constantly evolving market. Track sales* vs. your competitors every week, so you can make faster decisions.
※売上は車両販売台数を指し、車両価格や収益を示すものではありません。
The Facing Dealer Retail Sales Trend uses 13-month sales trend data to compare your sales performance to the competitive dealers in your Primary Market Area.
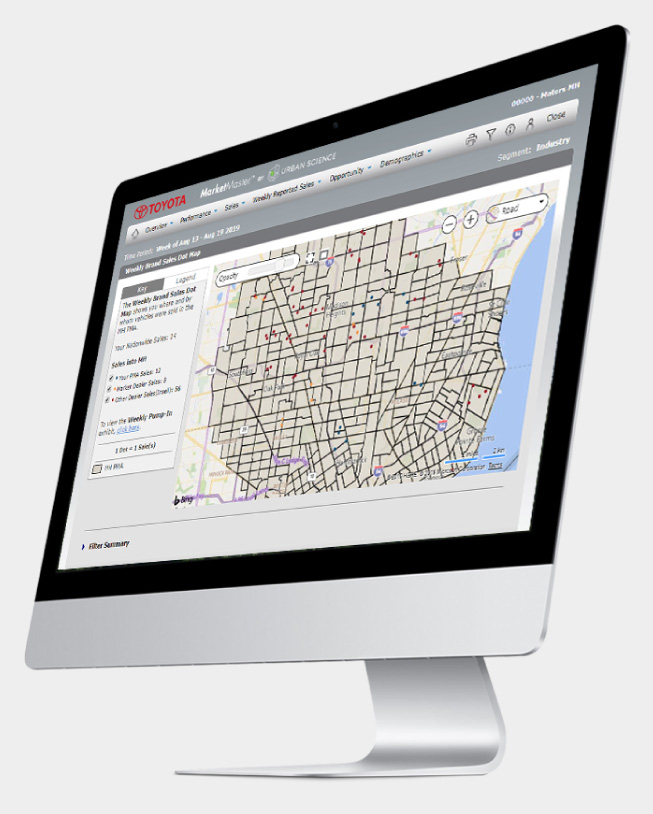
Stay ahead of the constantly evolving market. Track sales* vs. your competitors every week, so you can make faster decisions.
※売上は車両販売台数を指し、車両価格や収益を示すものではありません。
Every week, explore the latest sales in your Primary Market Area and discover where they came from on the Weekly Brand Sales Dot Map.
© Toyota Motor Sales, U.S.A., Inc. All Rights Reserved. |